Mapping & Civic Tech- Getting Started with the Basics
For Delaware Innovation Week 2017, we teamed up with our resident Mapping Guru, Stephen Hess. He gave us an awesome intro to digital mapping using JSON, and we’ve documented the whole tutorial.
This is a step-by-step tutorial easy enough for any mapping novice (or expert) to follow.
What is Mapping?
Various technologies go into a mapping provider:
- Data
- Rendering
- Search
- Navigation
When people think of mapping, they often think of Google Maps, Mapquest, or their personal GPS. In this workshop, we’re focusing on the data and the rendering of that data.
Some really cool examples of what mapping can do:
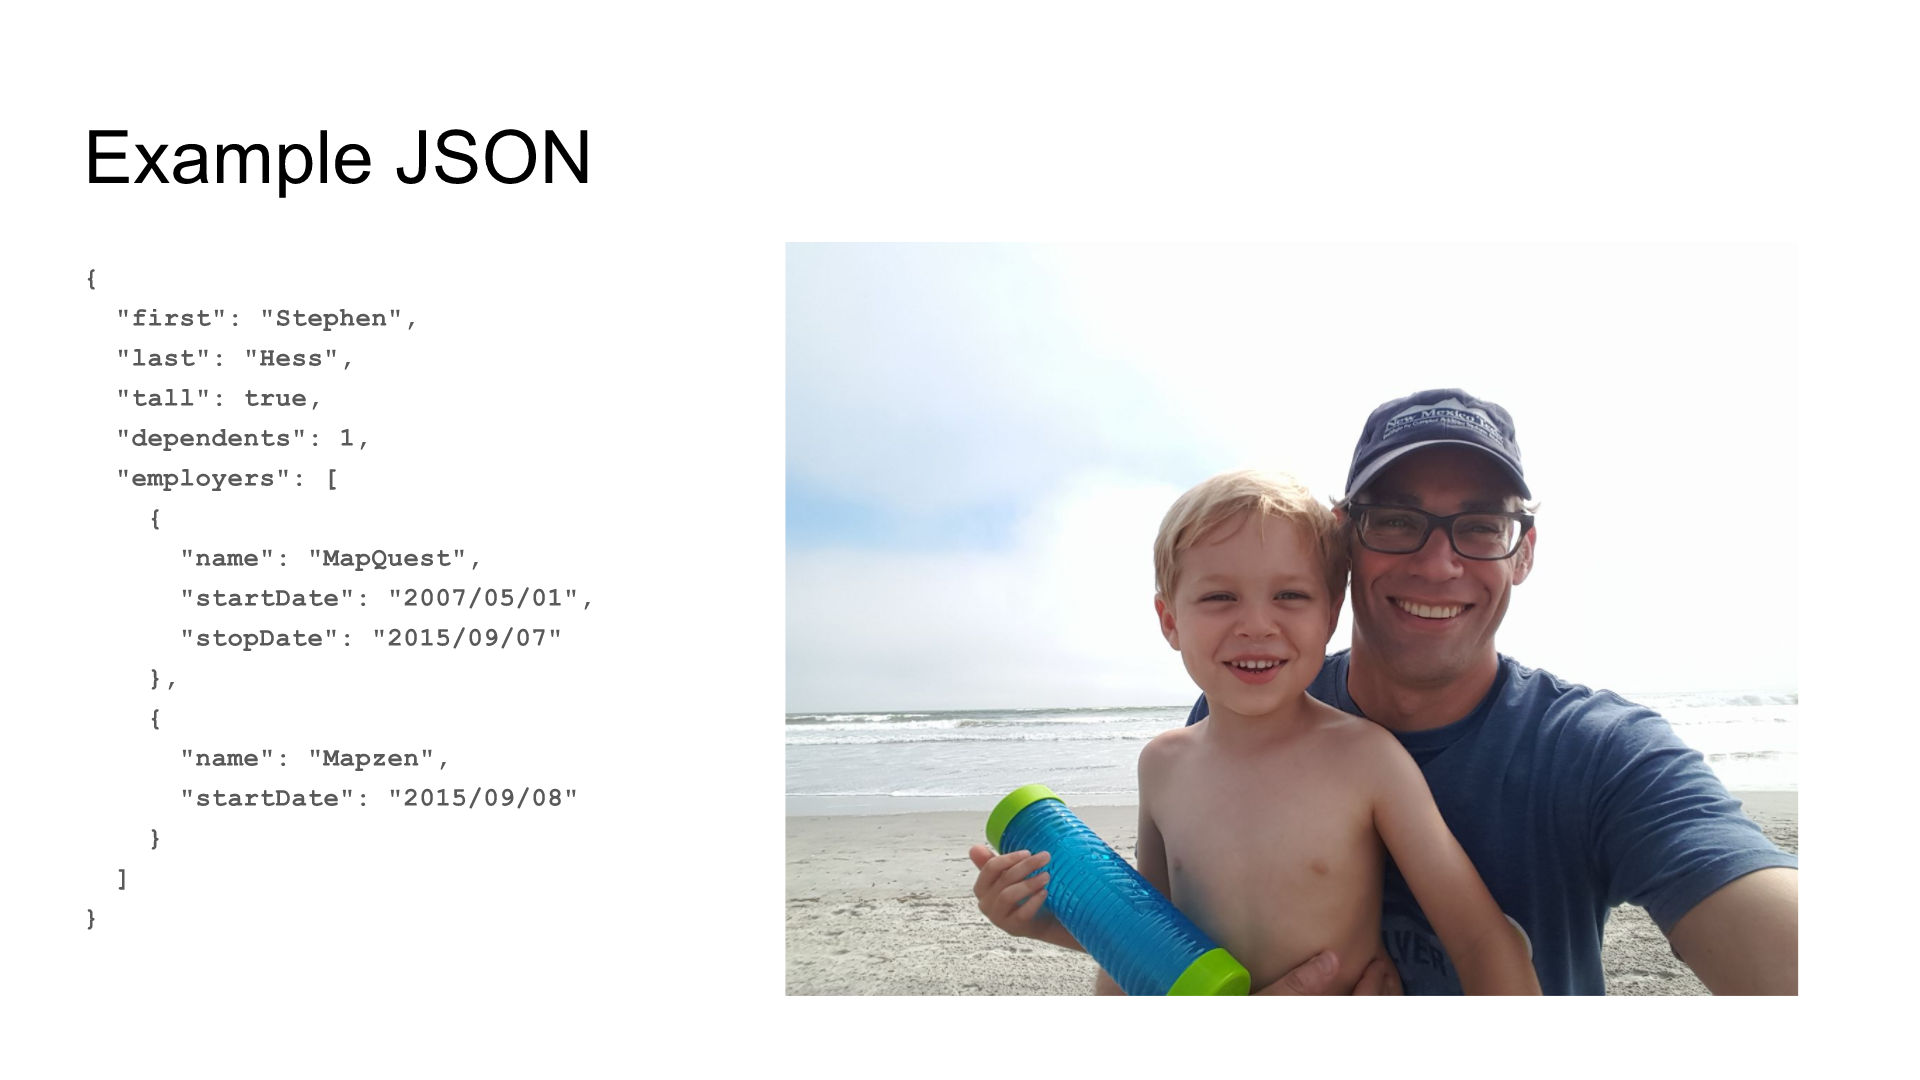
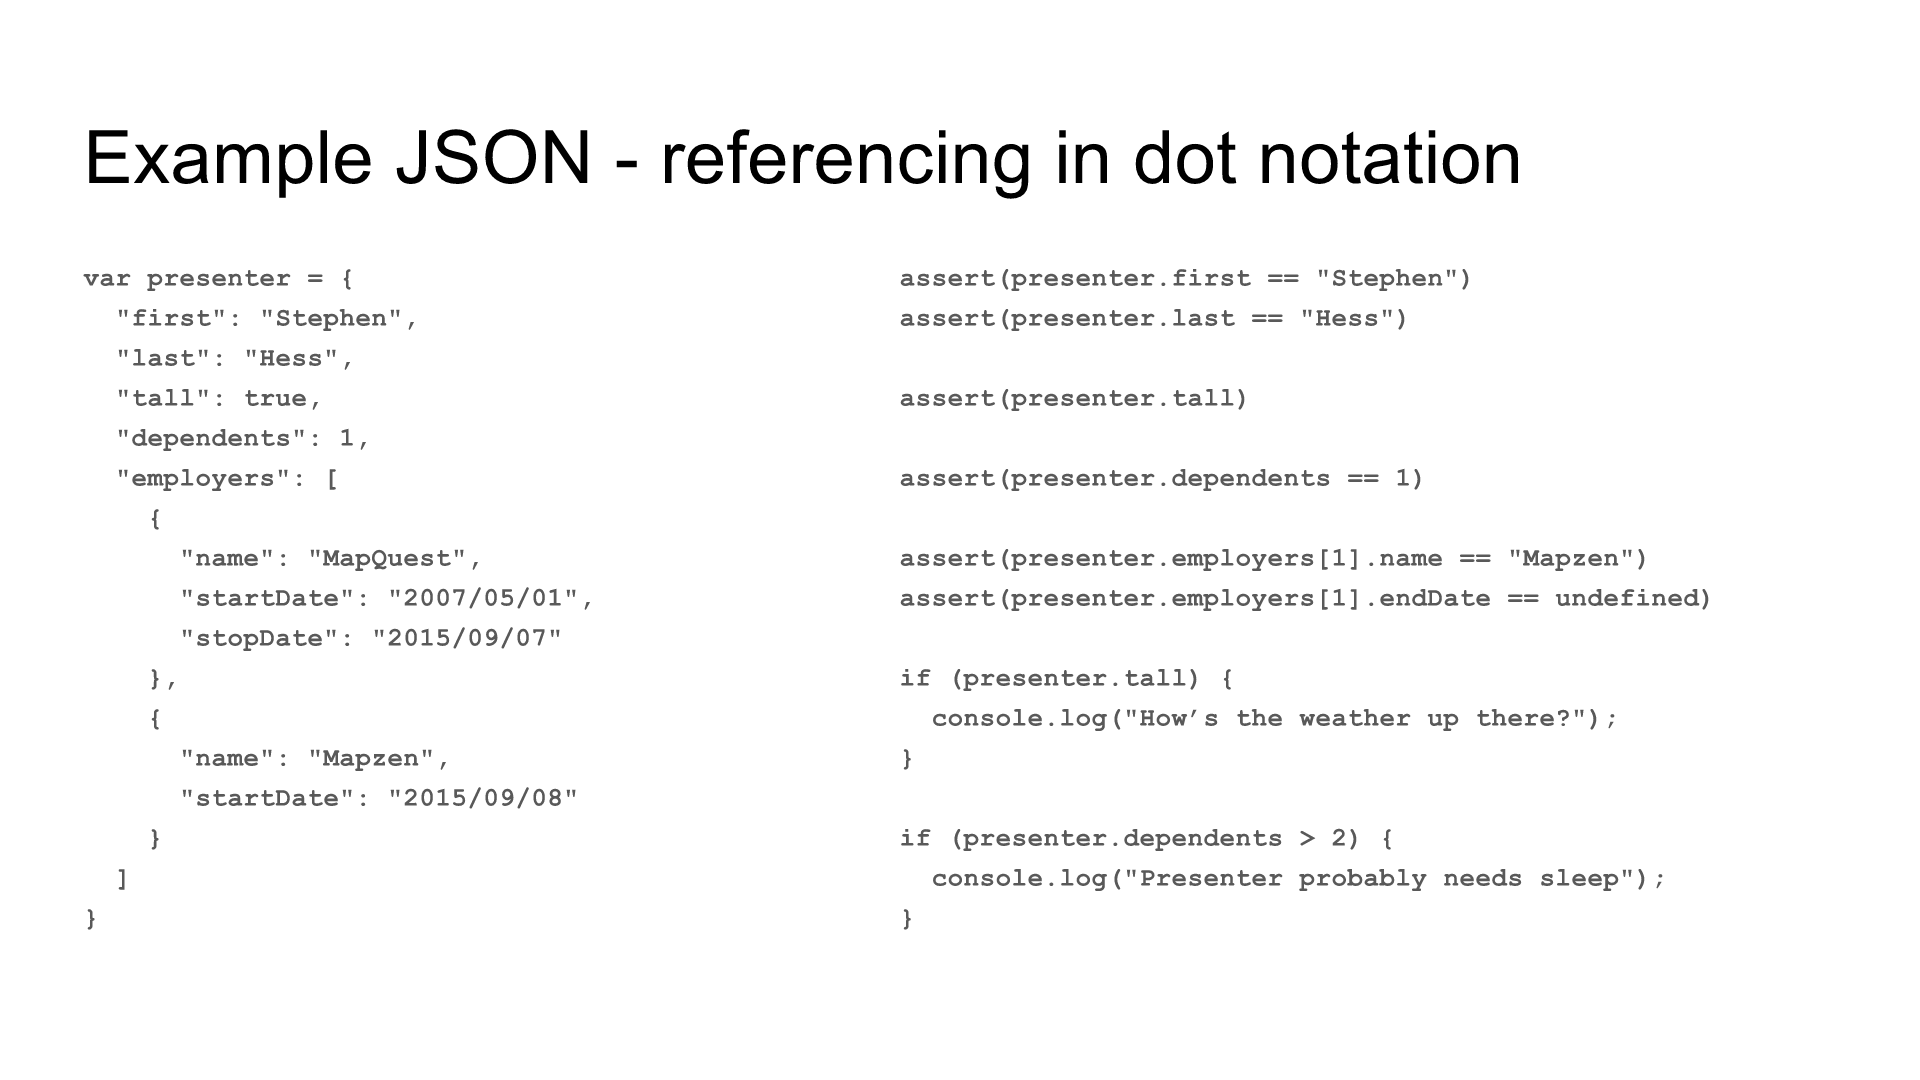
Blazingly Fast Introduction to JSON
JSON stands for JavaScript Object Notation. It’s used for data storage and transmission. It has a low-overhead, open standard file format, and is highly compressable and human-readable (not all zeros and ones).
A very cool aspect of JSON is it’s ability to support a wide range of data types:
- booleans
- numbers
- null
- strings
- objects
- arrays
Geo Data Formats
There are a number of storage mechanisms for geo data–what’s used to make digital maps:
This tutorial focuses on GeoJSON.
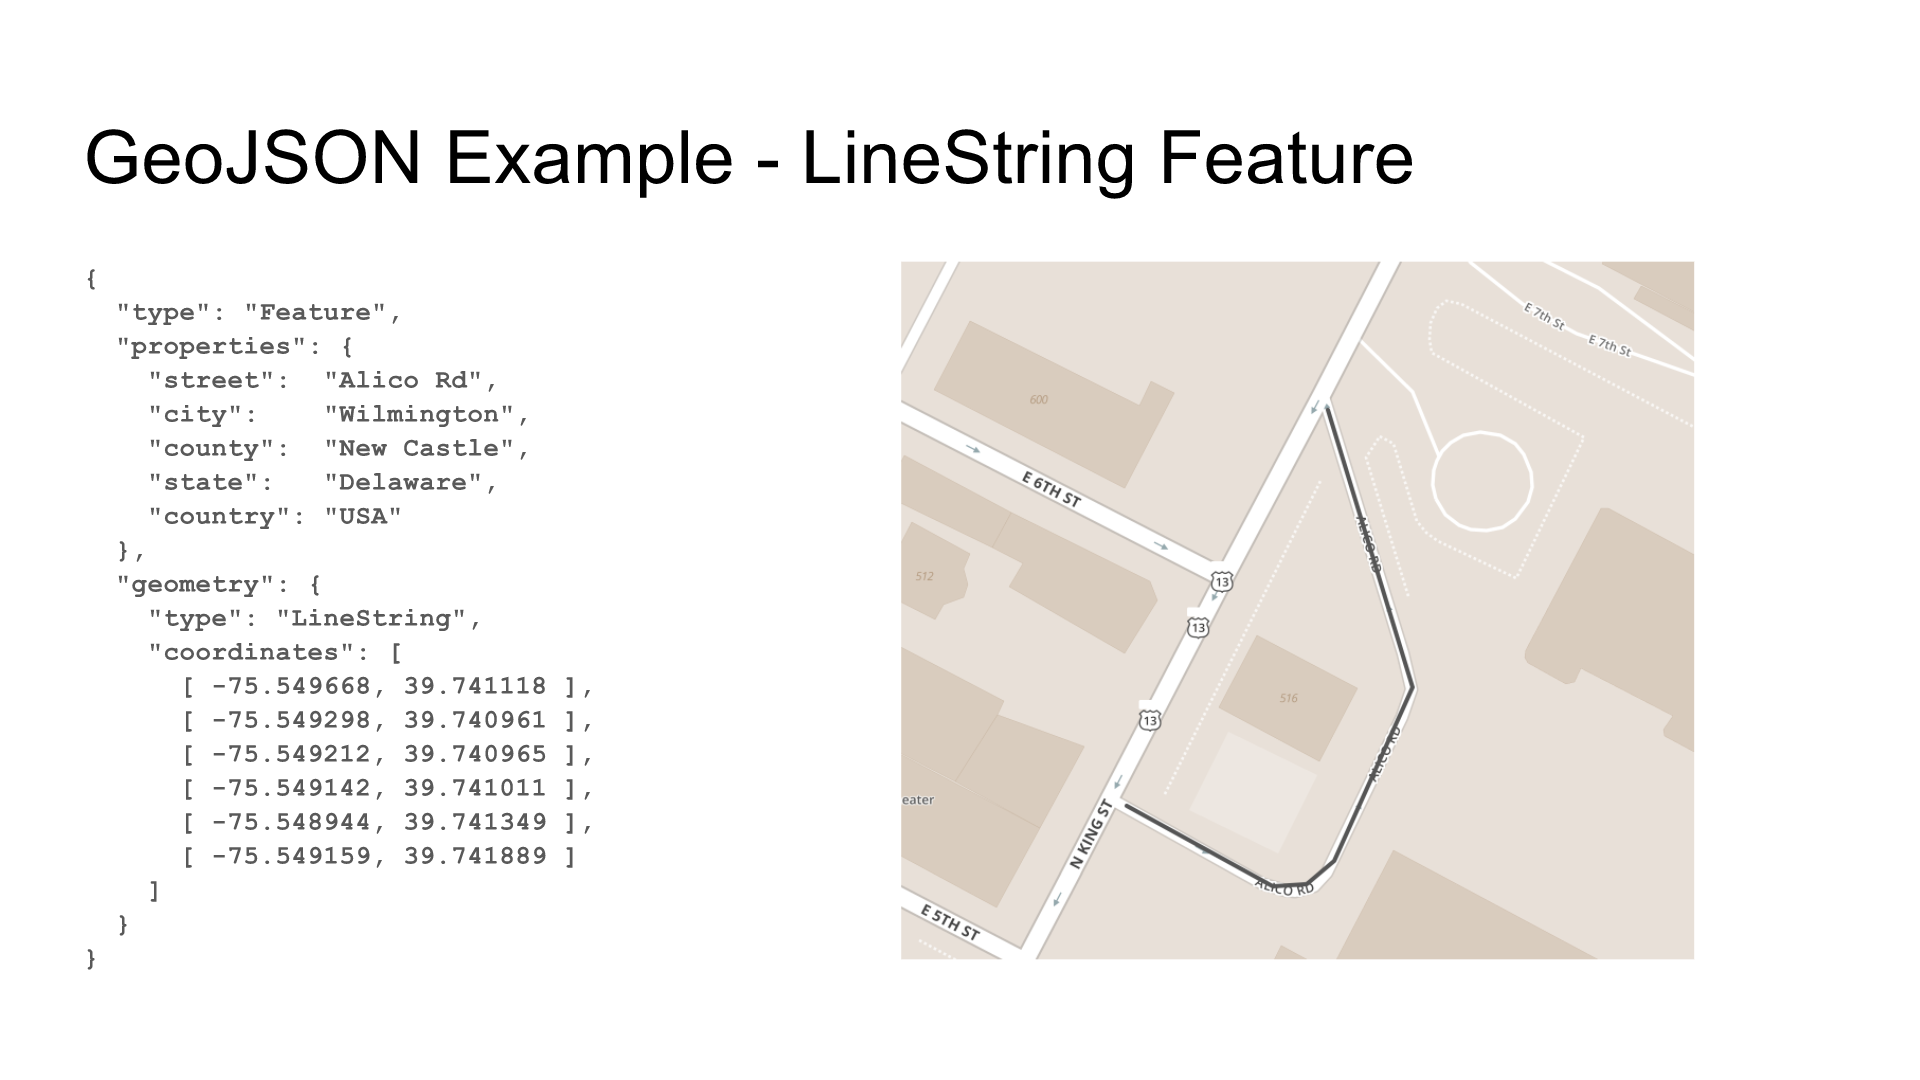
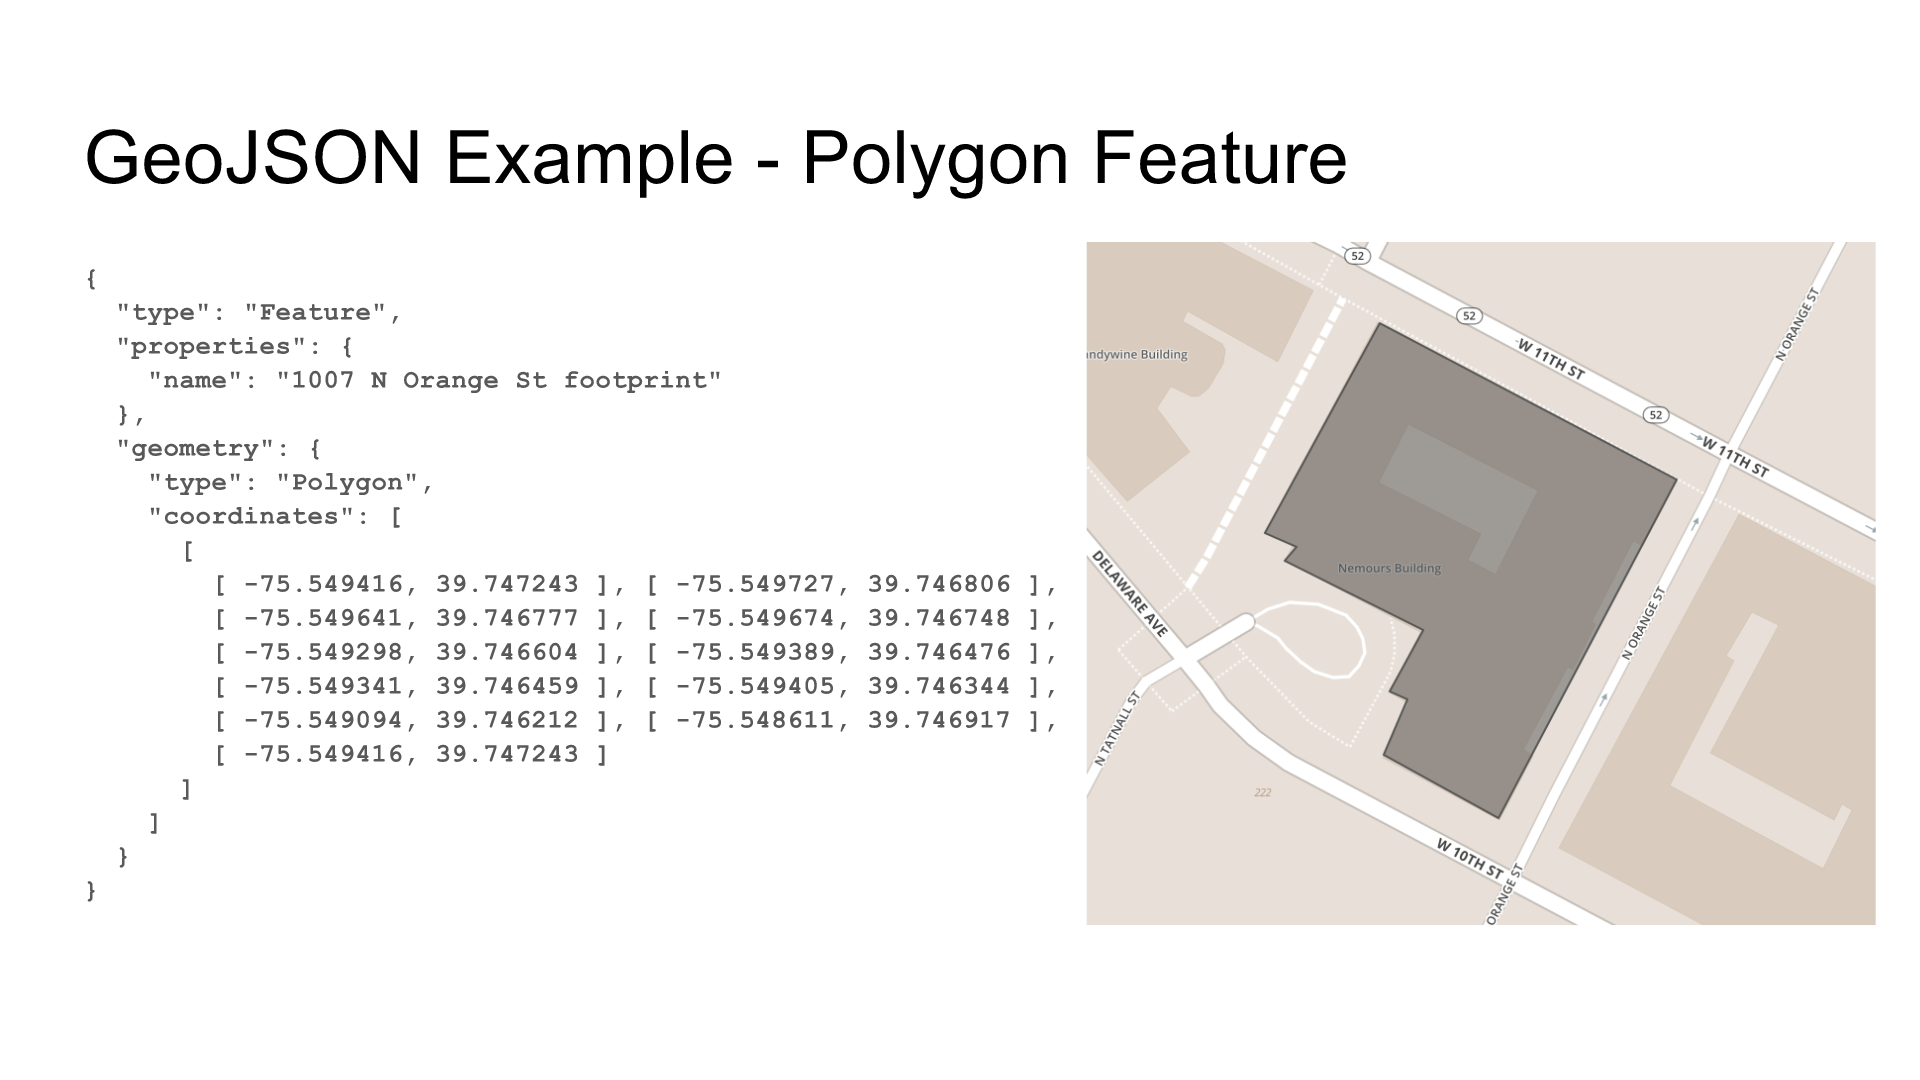
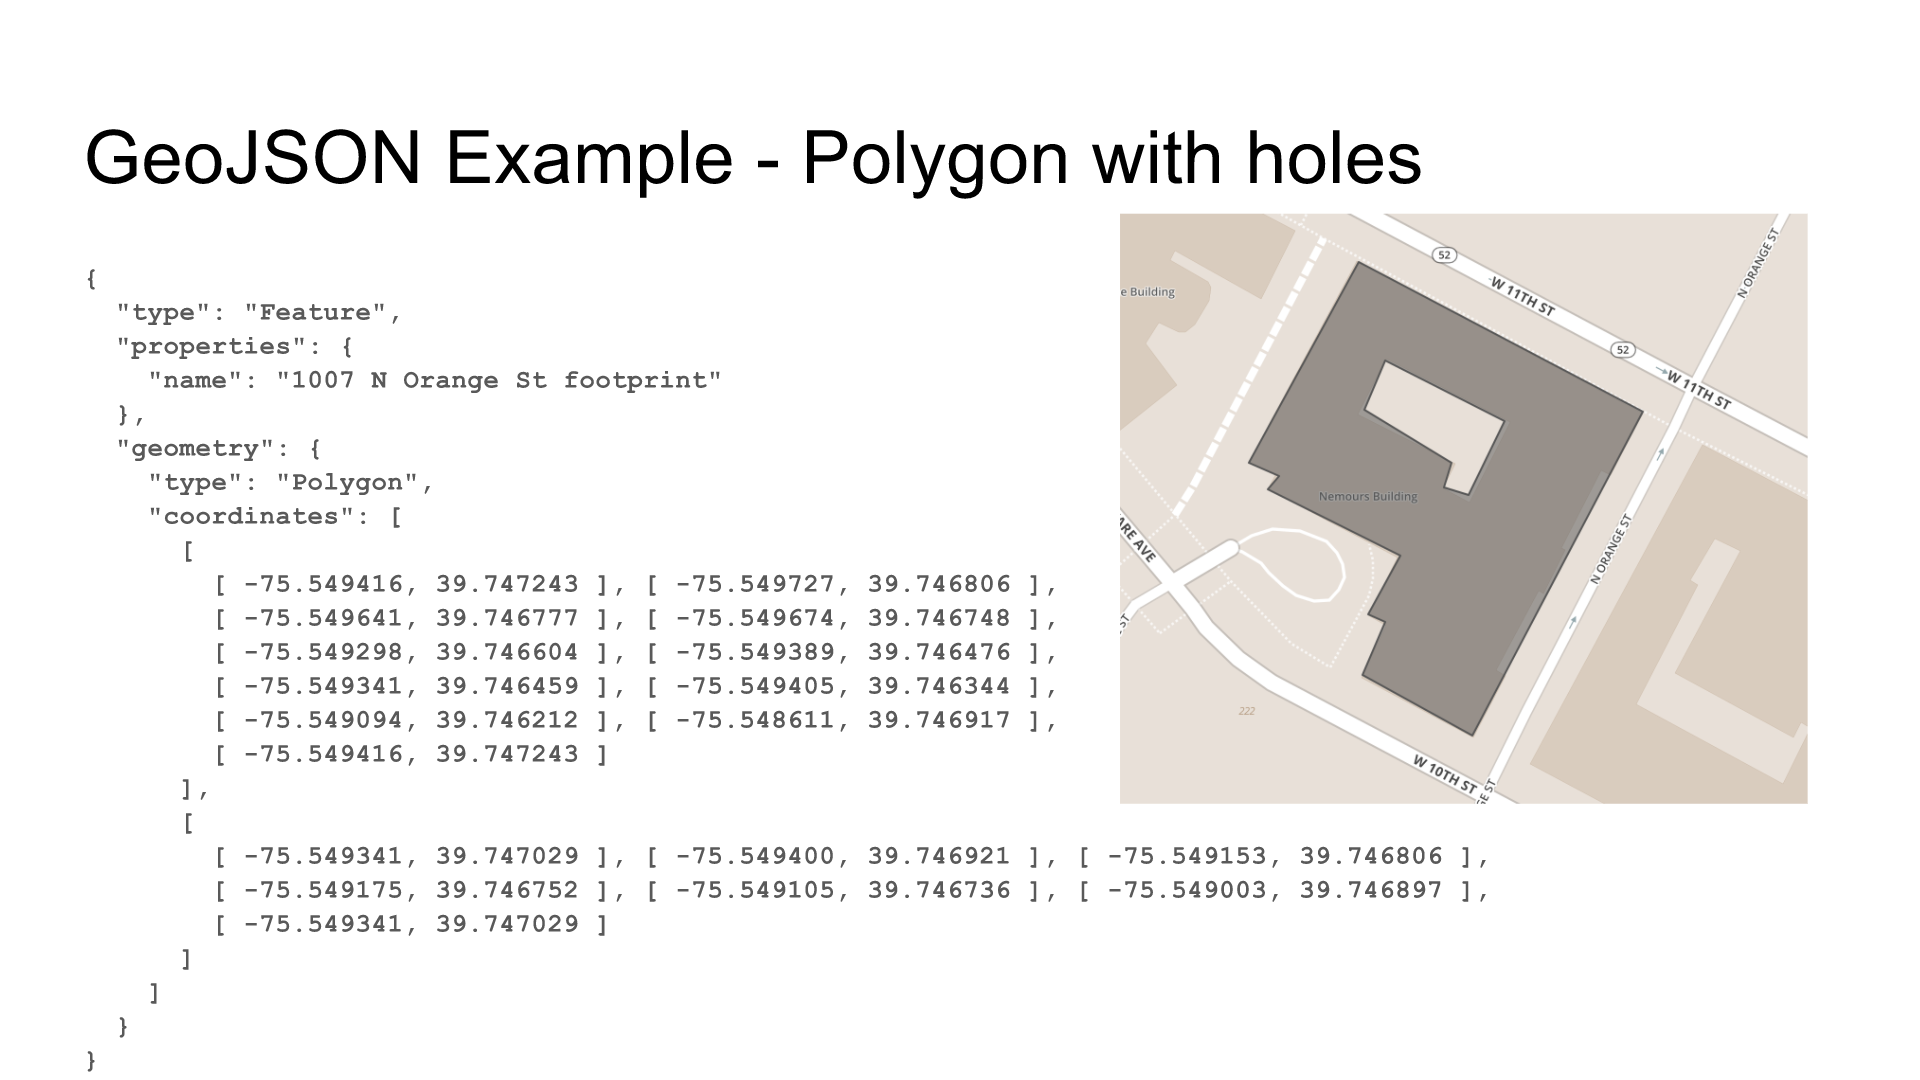
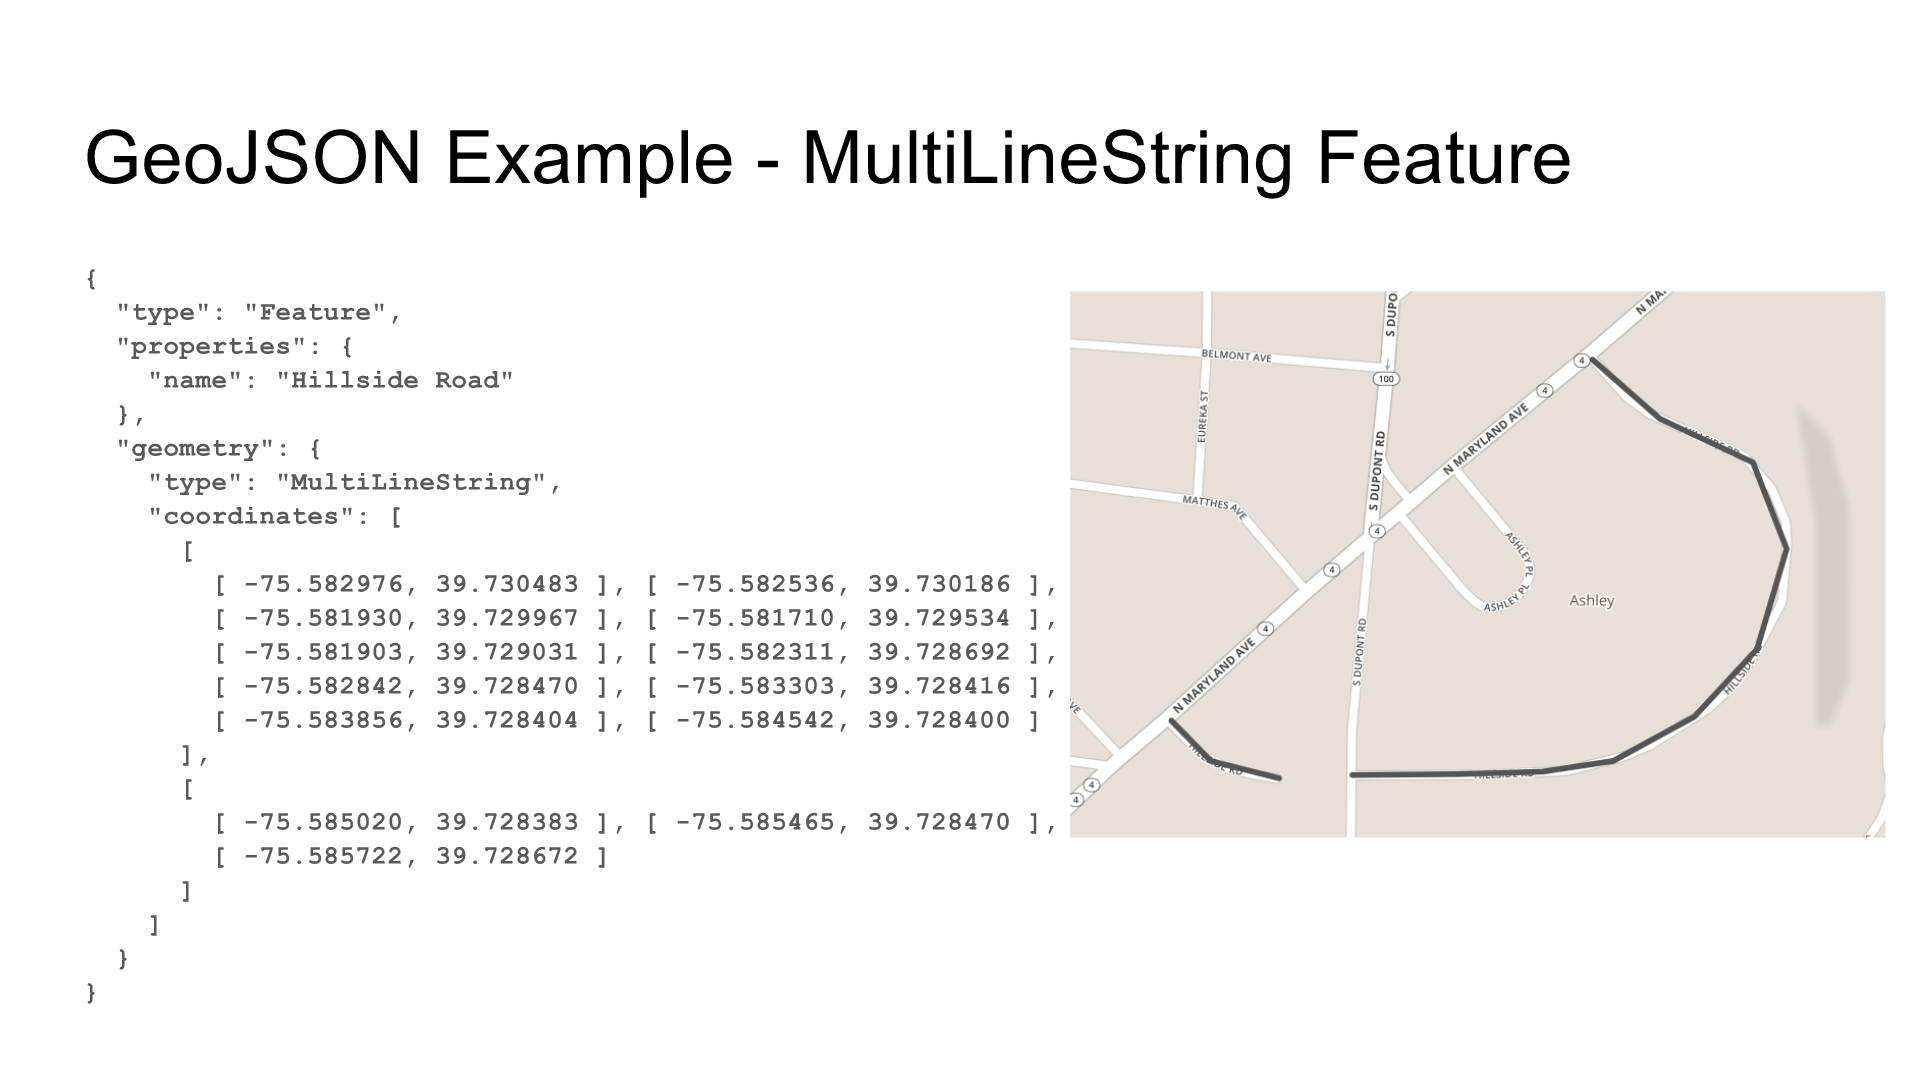
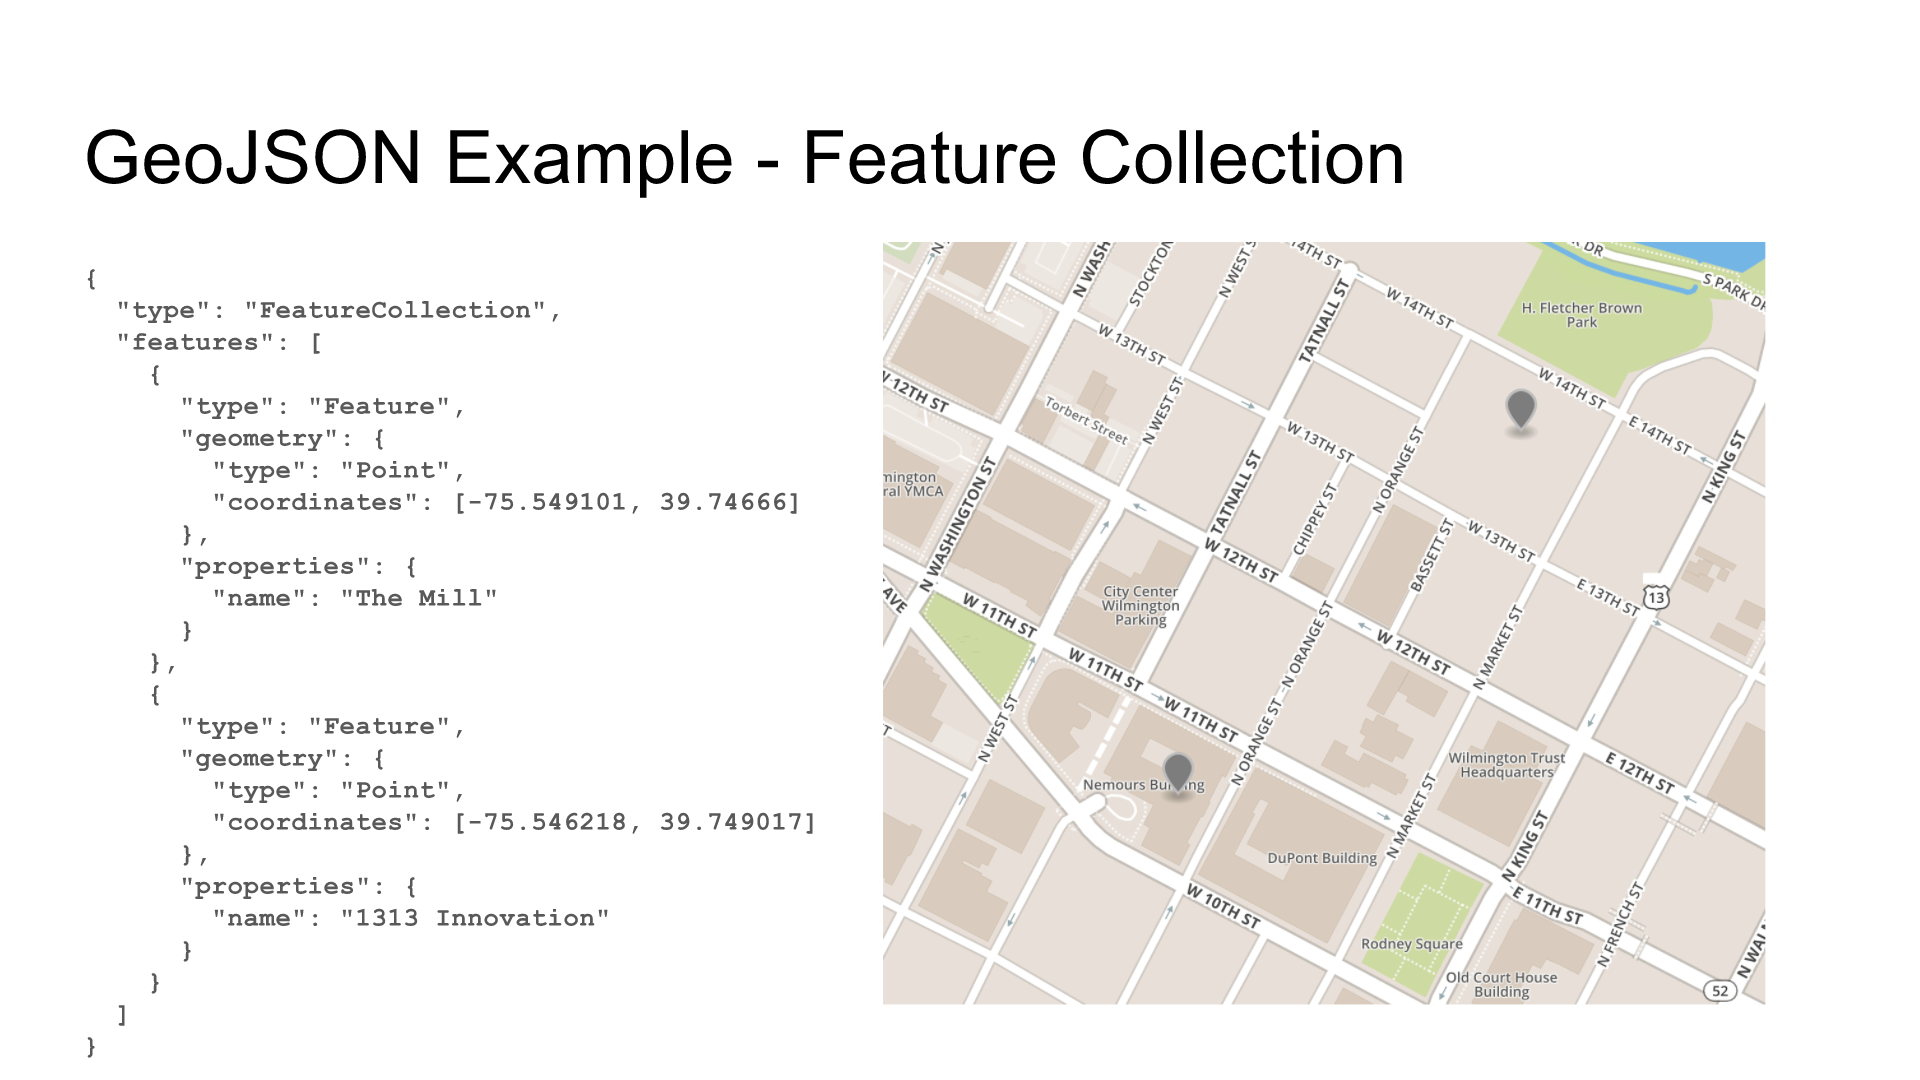
Intro to GeoJSON
JSON syntax formatted for geographic features Points, Lines, and Polygons.
It’s defined as a series of longitude/latitude pairs. 2d description is required in GeoJSON, but 3d is optional.
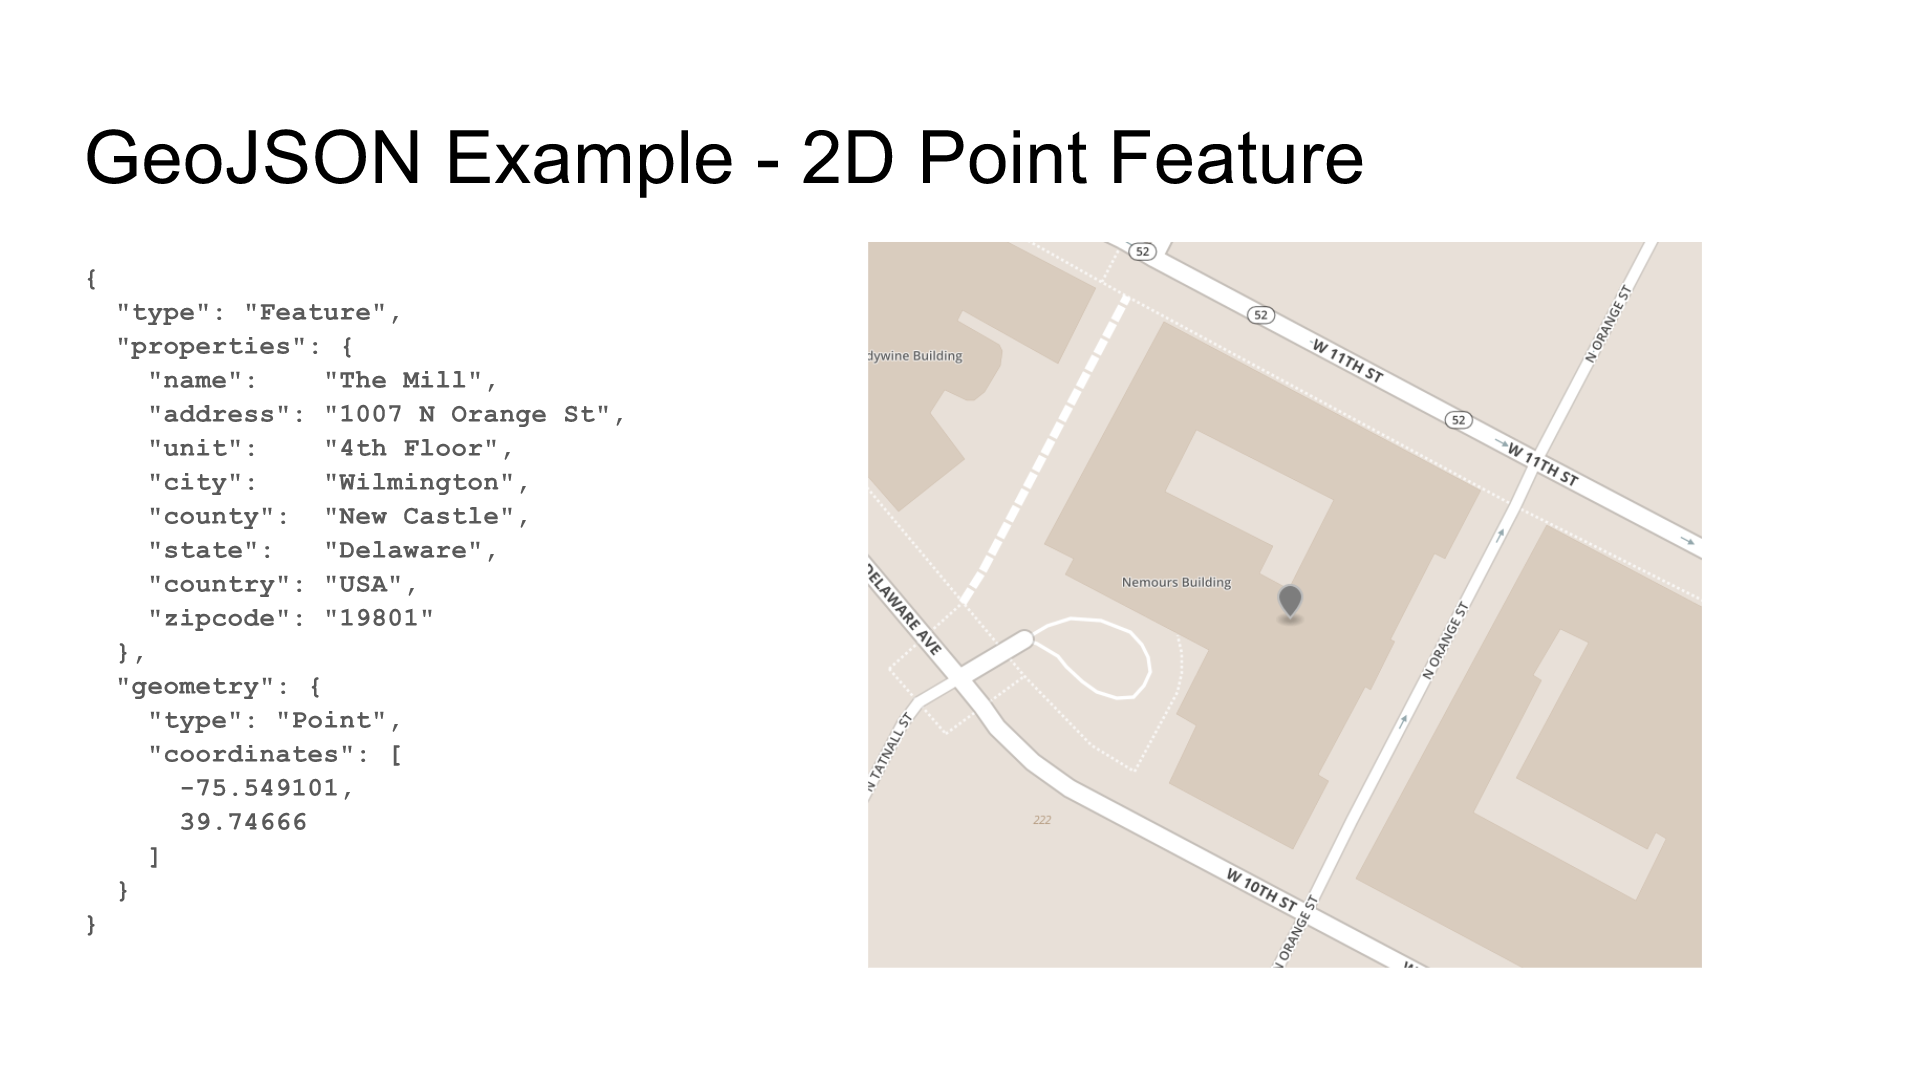
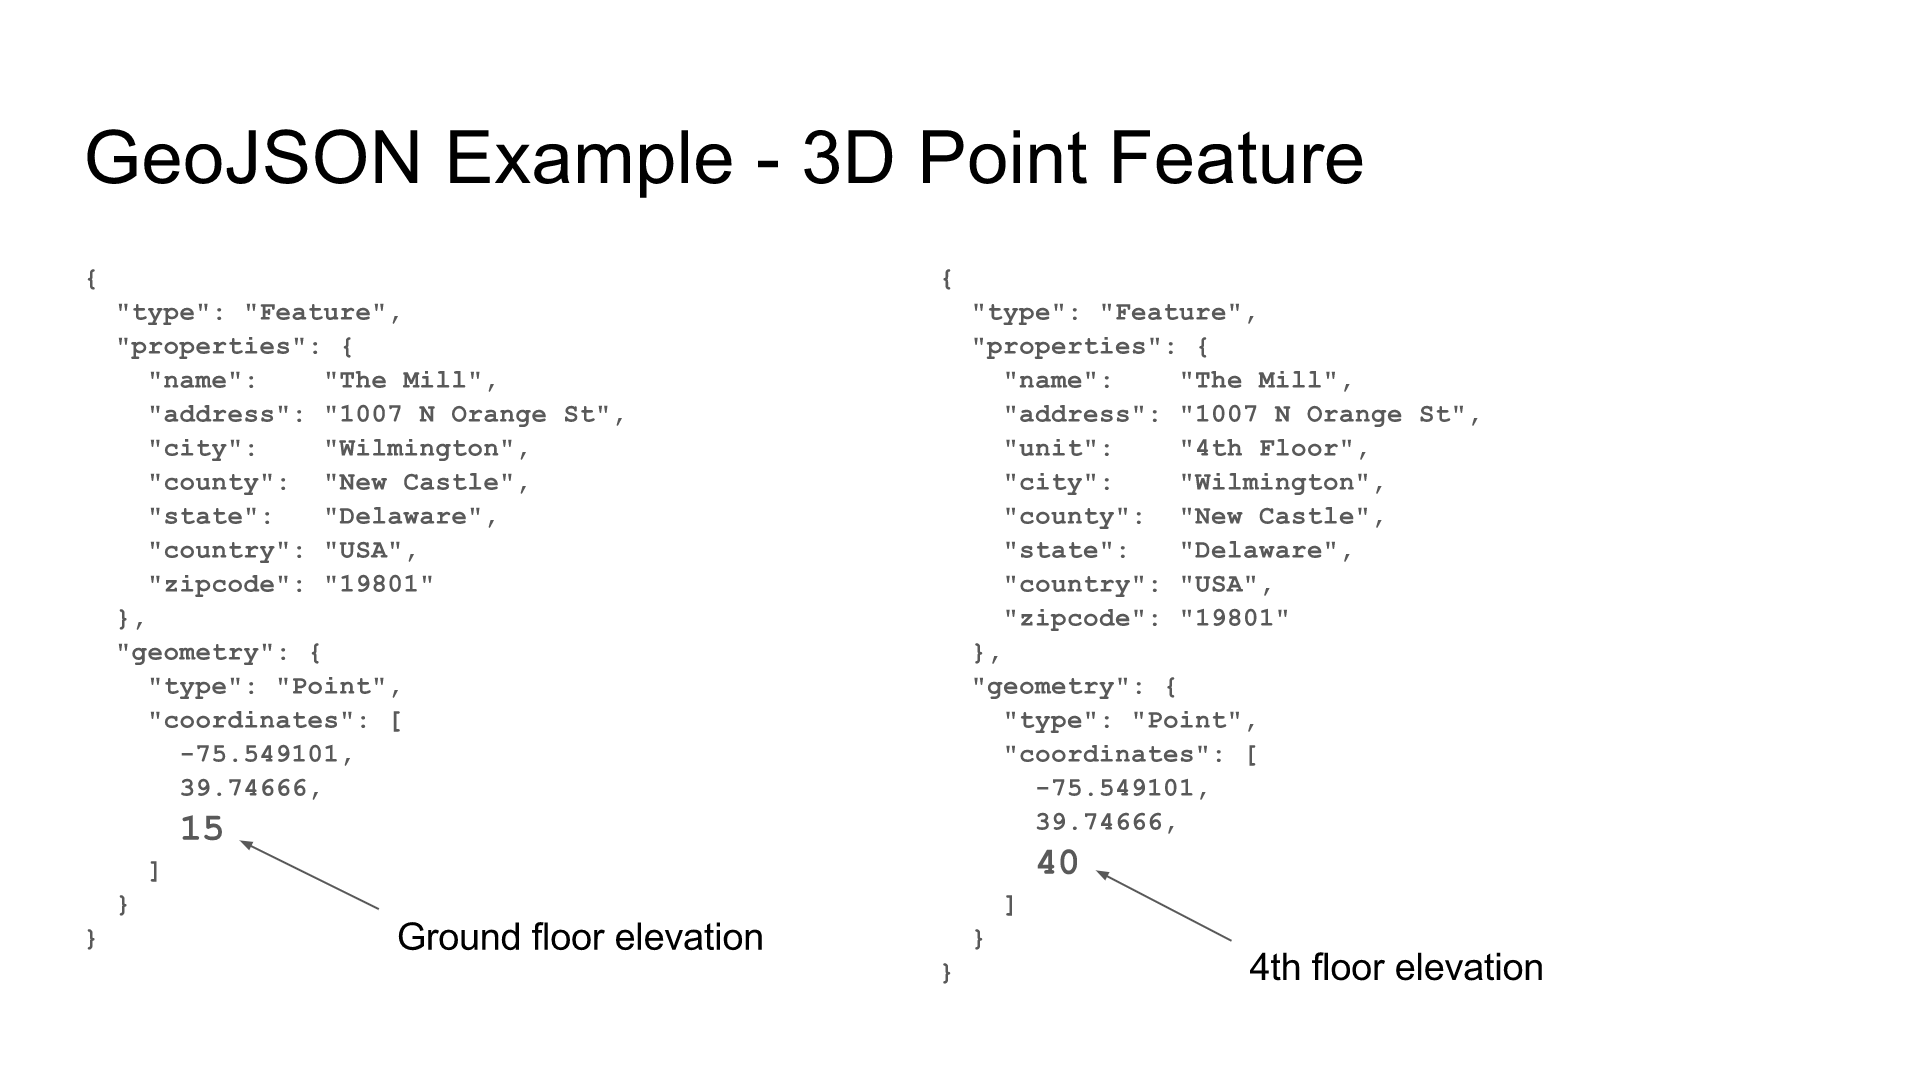
GeoJSON can also be what’s called single or double. This refers to both the Feature and FeatureCollection, as well as Point vs MultiPoint, LineString vs MultiLineString, and Polygon vs MultiPolygon. Find detailed descriptions of all of these on the GeoJSON Offical Manual, Oracle’s GeoJSON Guide, or Leaflet’s Handy Tutorial.
It’s also important to note that GeoJSON supports straight line geometries…which means no circles or curves allowed. You can, however, give the appearance of curves by creating a series of very short lines.
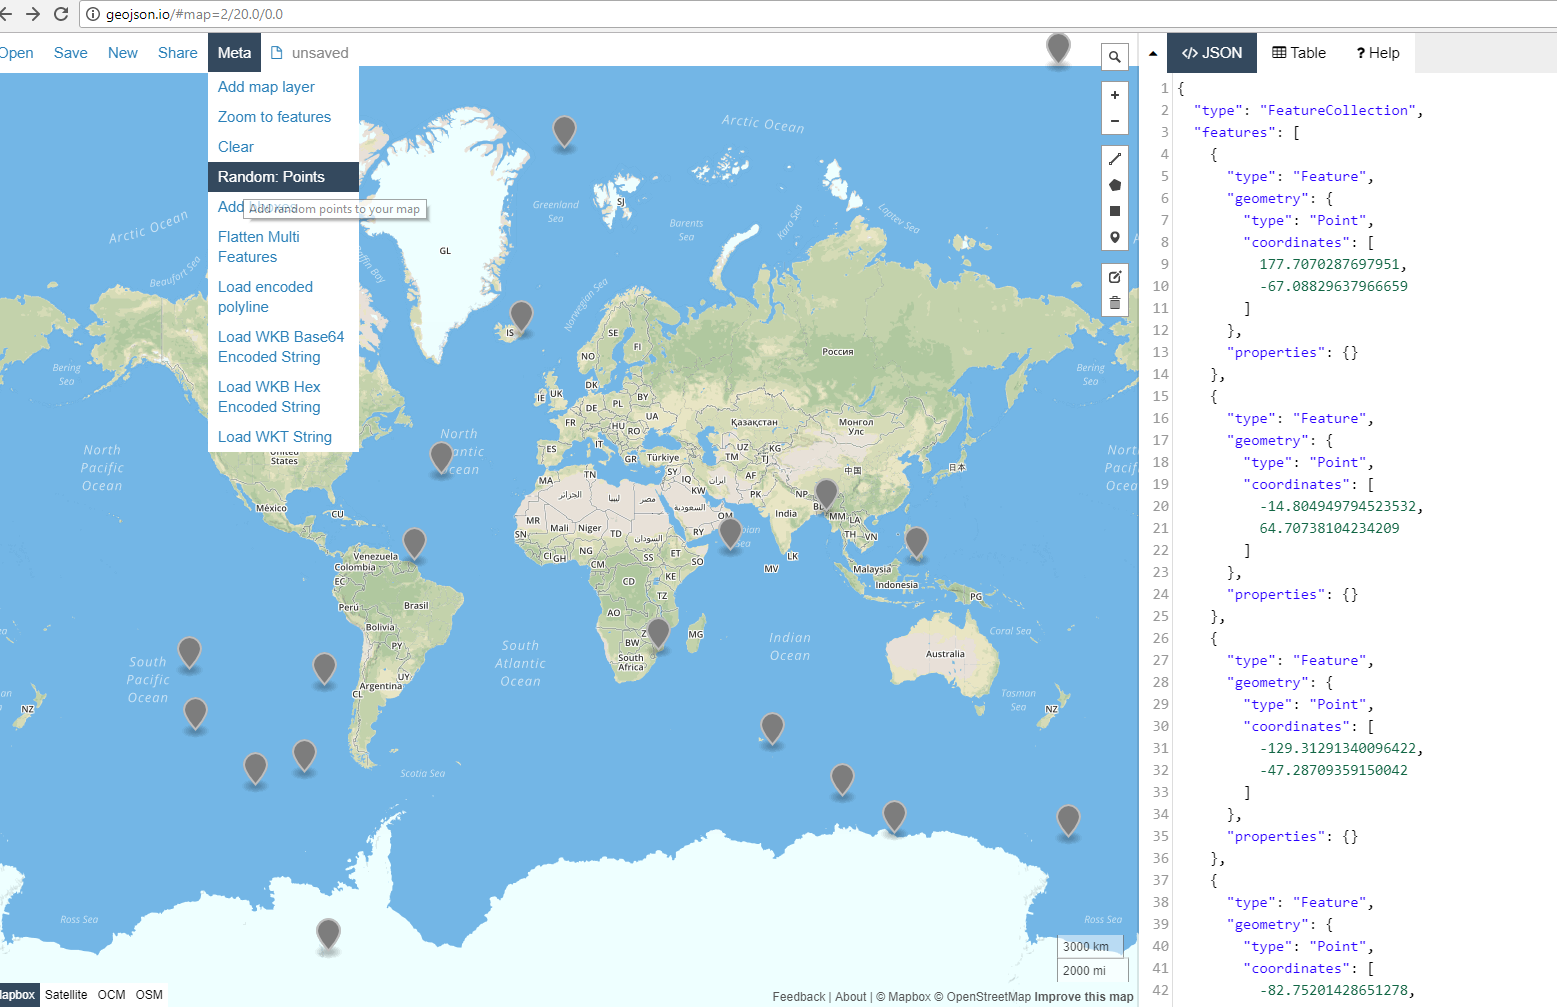
The Magic of GeoJSON.io
GeoJSON.io is a super cool open source project anyone can use to build maps for their own use. You can read a little more about it here.
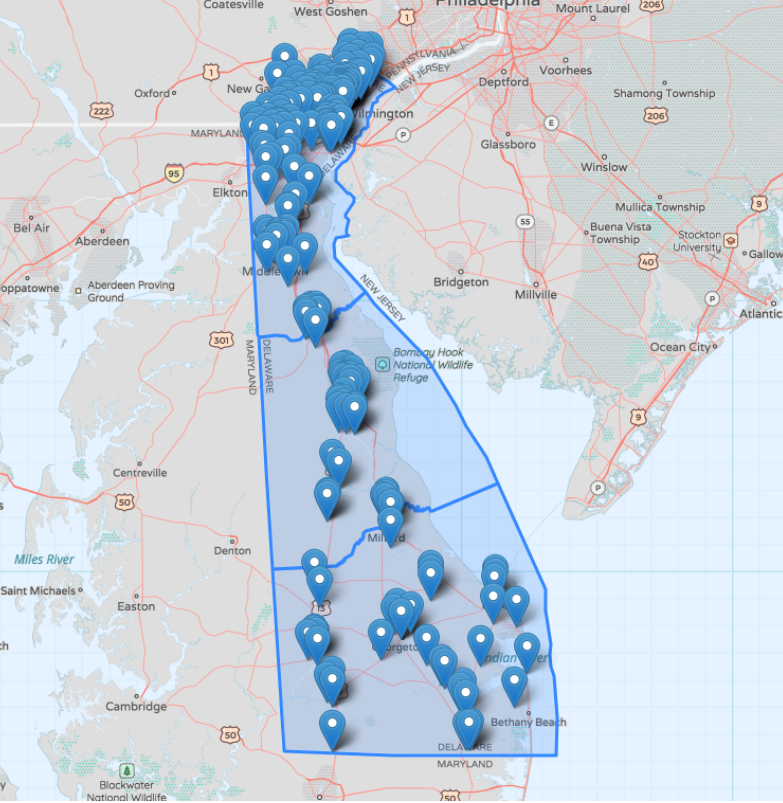
You can use it to locate random points (helpful if you need to see some sample geoJSON:
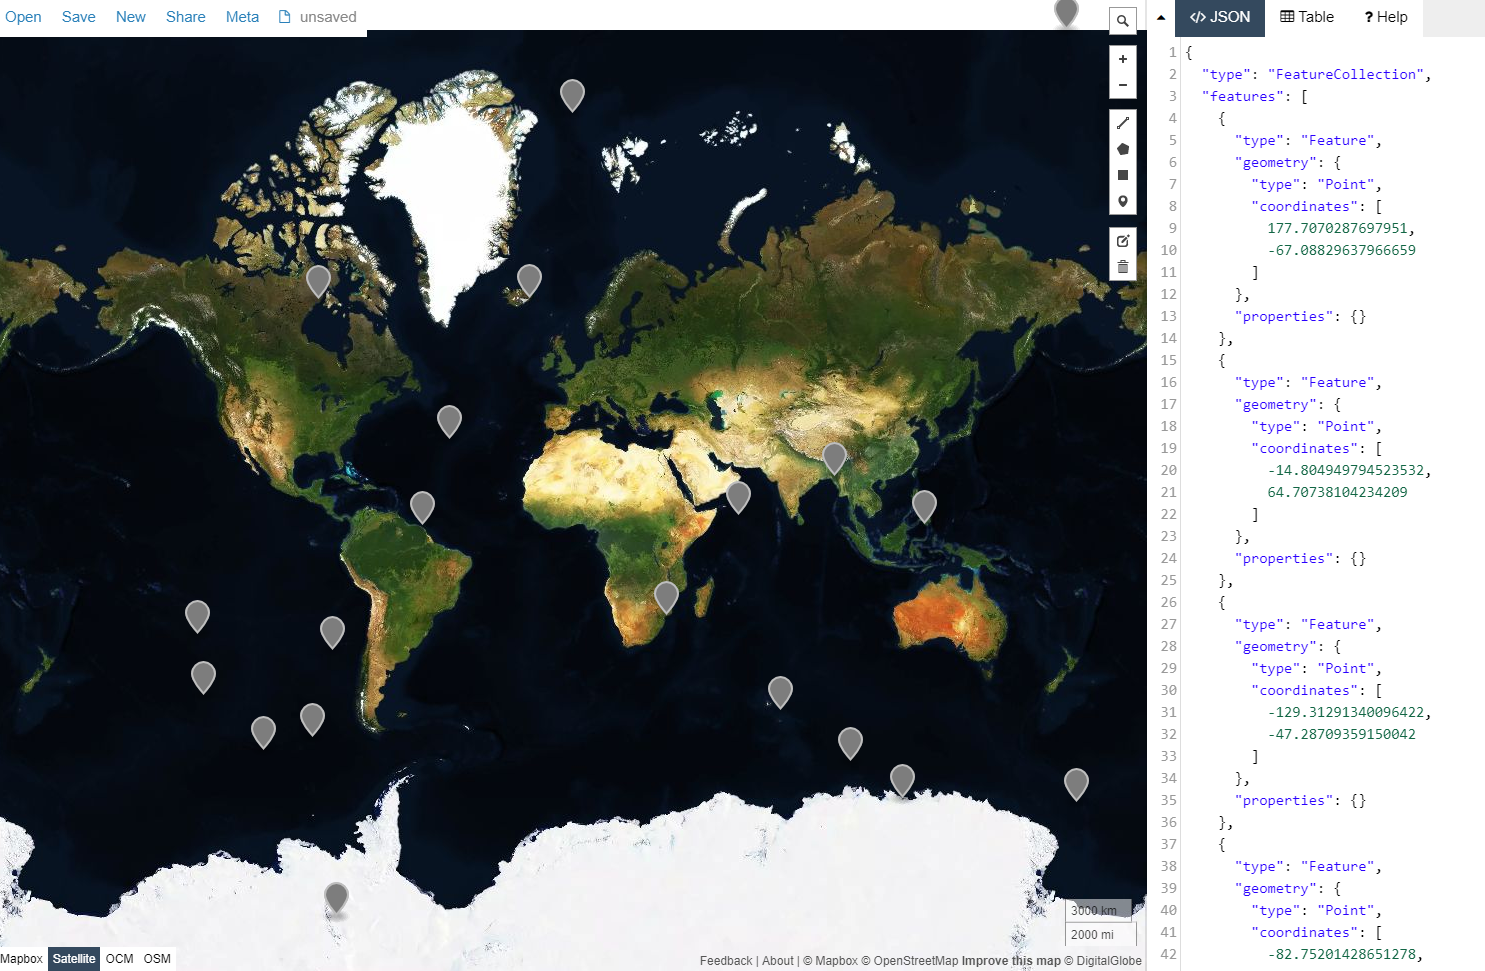
You can also change the view layers from drawing to Satellite (you can zoom in pretty unnervingly close, too)
Now we can start actually doing things. Whatever GeoJSON you add in the right-hand toolbar will display in your map.
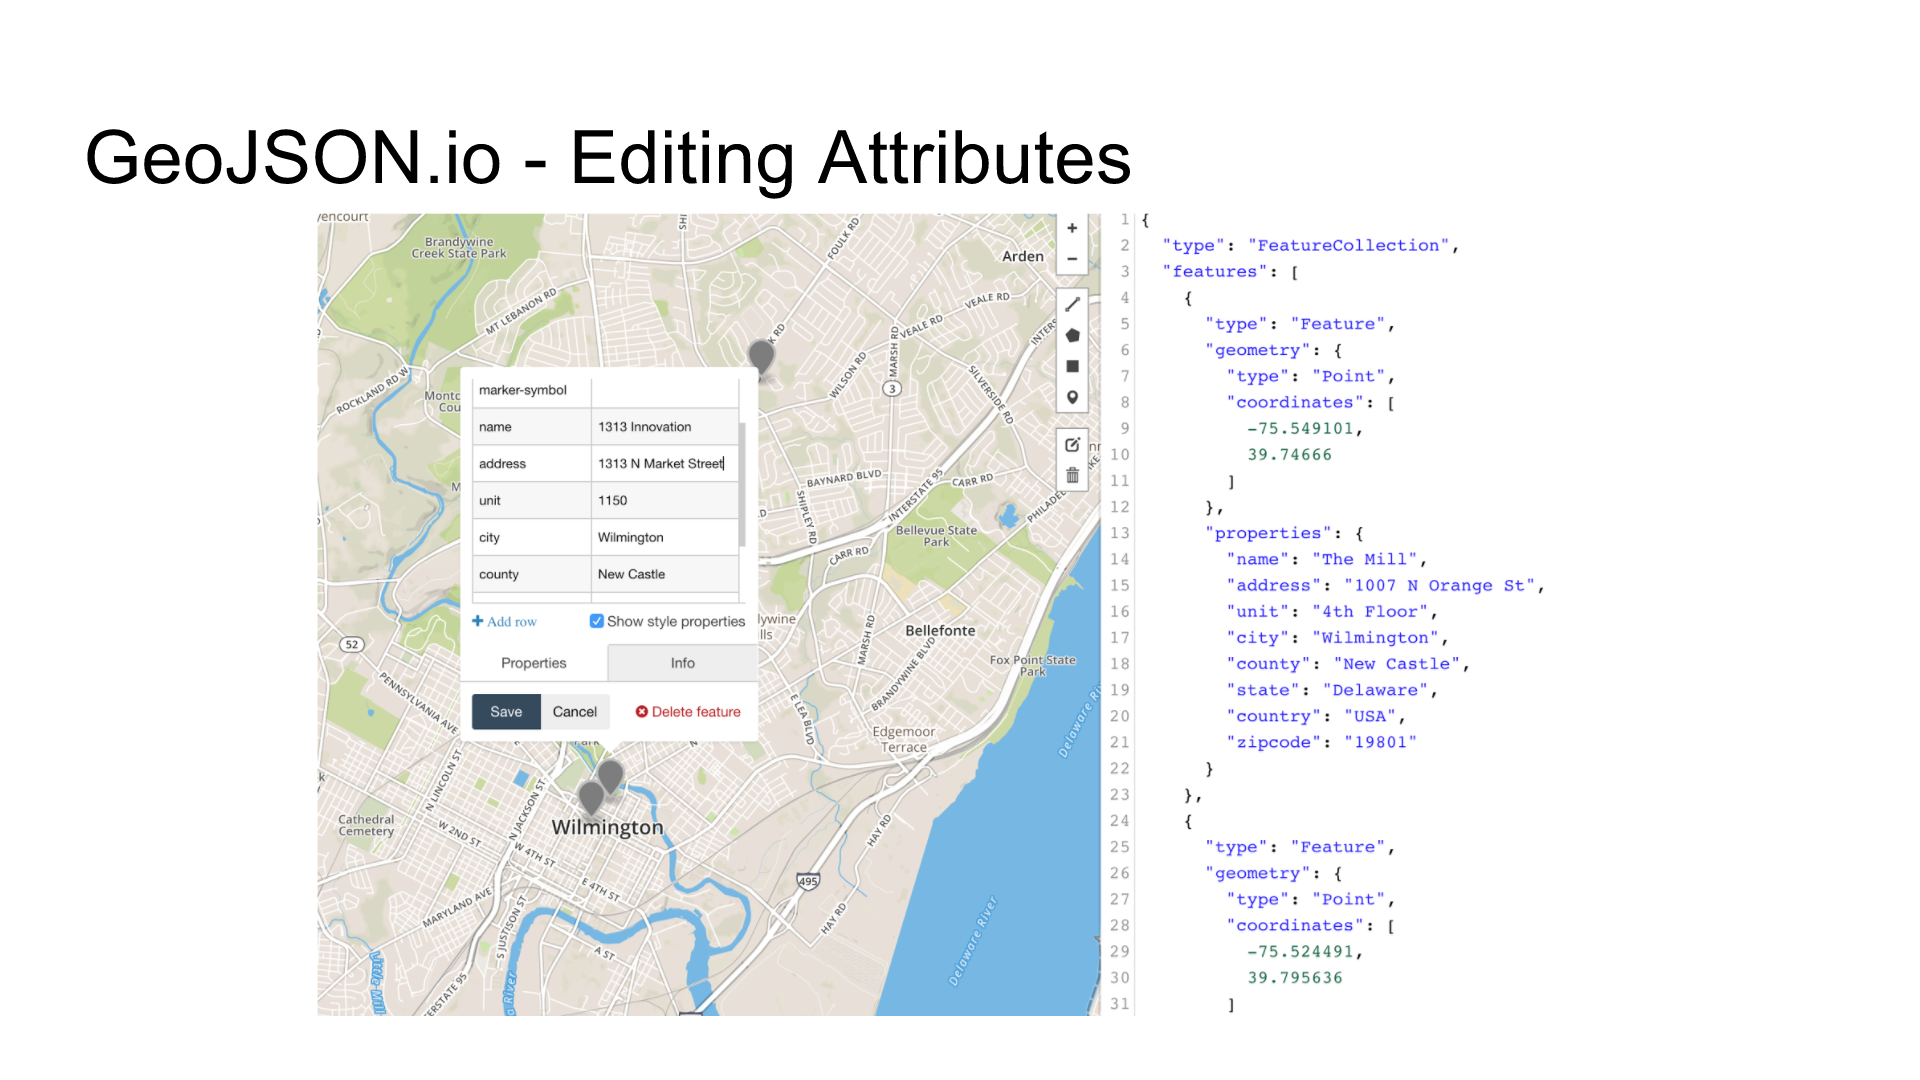
Like, for example location data for Open Data Delaware events
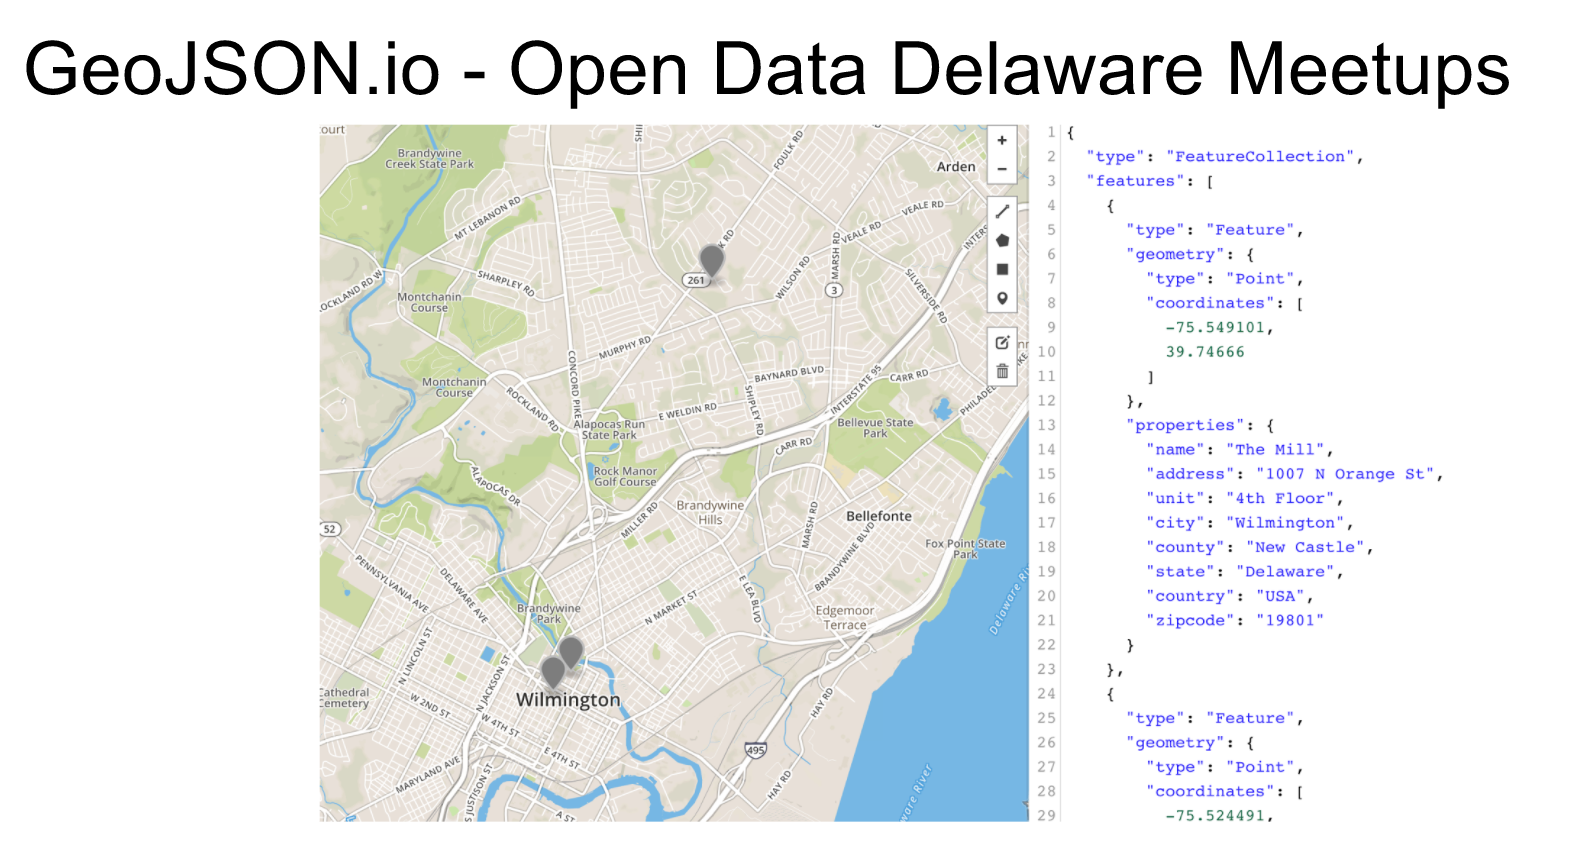
You can also edit the attributes of a feature, either by directly changing the code, or by clicking on the desired point and editing using GeoJSON.io’s UI.
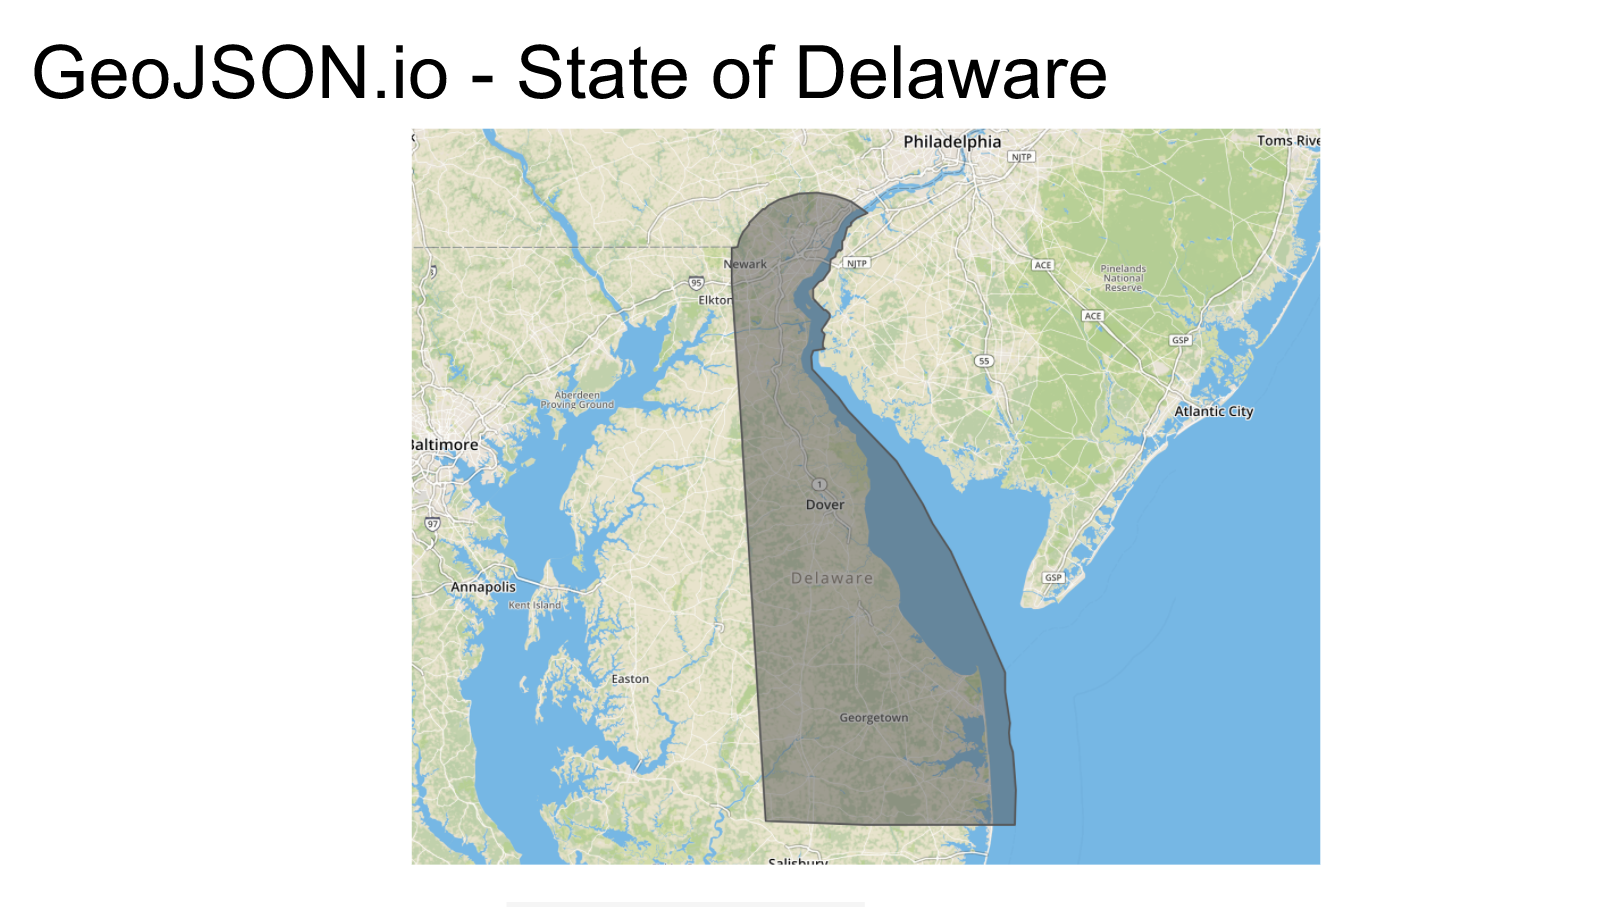
Or, if you wanted to shade in an area, you can do that, too, using data like this (Note that the illusion of a curve in the below example is created by just a ton of small straight lines.)
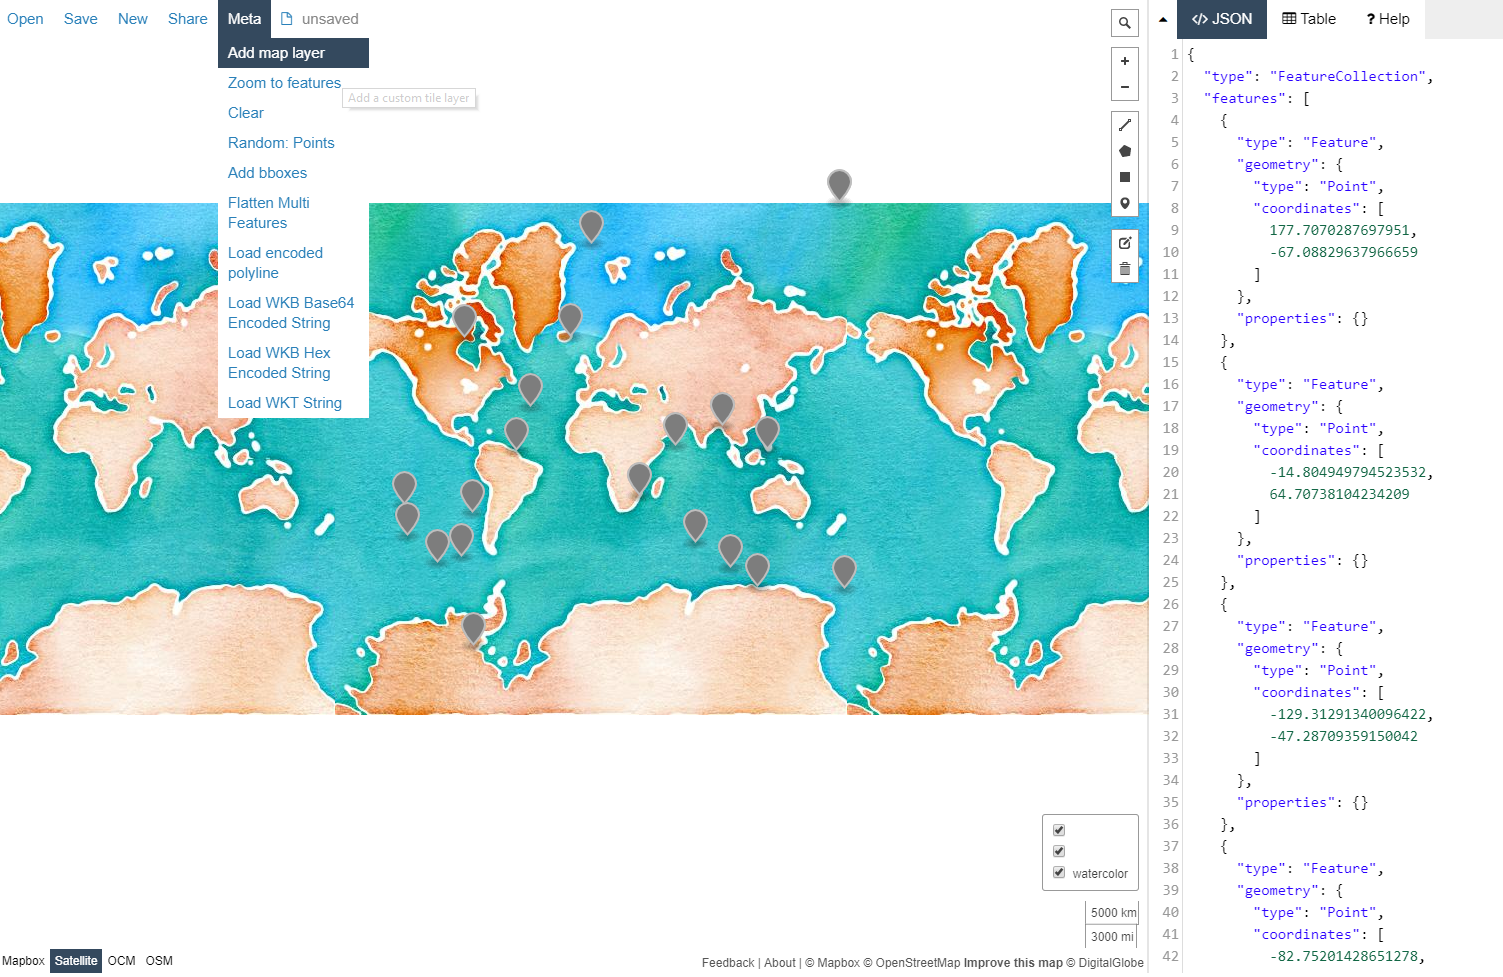
And, of course, you can change what your map layers look like. Try creating a watercolor effect by typing http://tile.stamen.com/watercolor/{z}/{x}/{y}.jpg into the Add map layer option in the Meta dropdown, like this:
Getting Started with Leaflet and Mapzen.js
Leaflet is “an open-source JavaScript library for mobile-friendly interactive maps.”
The Mapzen JavaScript SDK provides access to Mapzen services with a small wrapper around Leaflet.
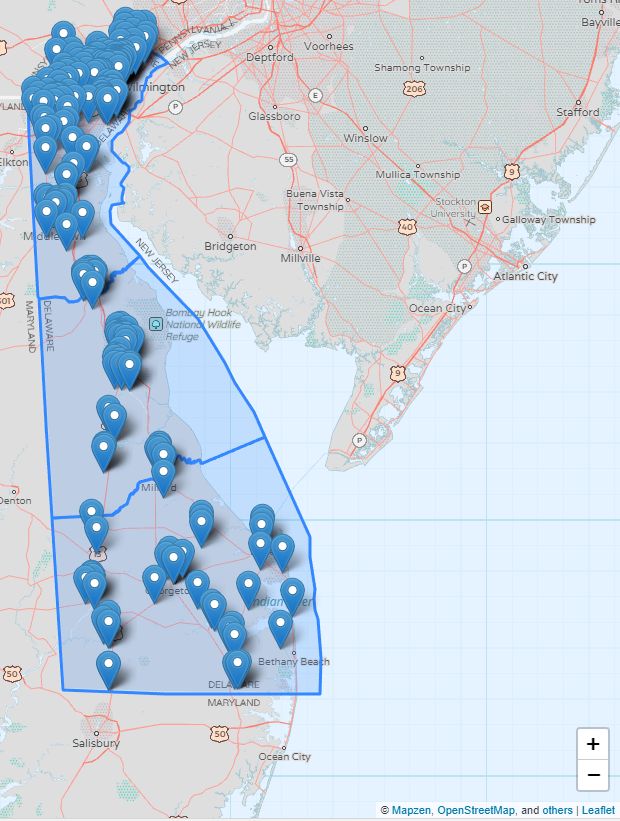
Using this combination, you can create interactive maps, like this one about DE Schools.
We’re going to learn how to build this step-by-step.
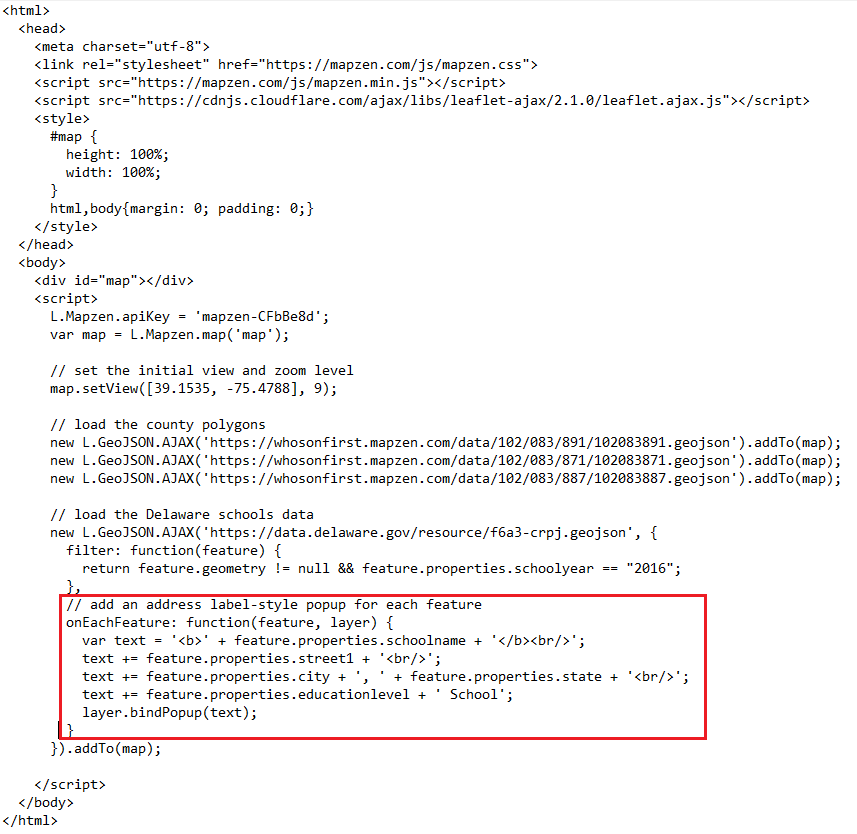
Step 1: Set Up Your Code Base
Visit this GitHub page and click on the index.html link. Copy all contents of this file into a local file and save. Open the local index.html in a web browser.
This is the completed map as we learned to build in this workshop. It shows all schools in Delaware in 2016. Notice the state is highlighted in sections of counties and each point (or school) is clickable with information contained in a pop-up window.
So how is it done?
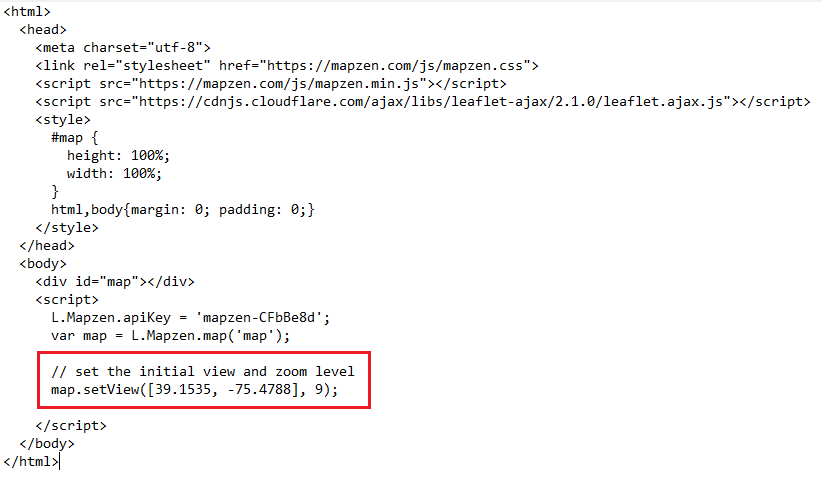
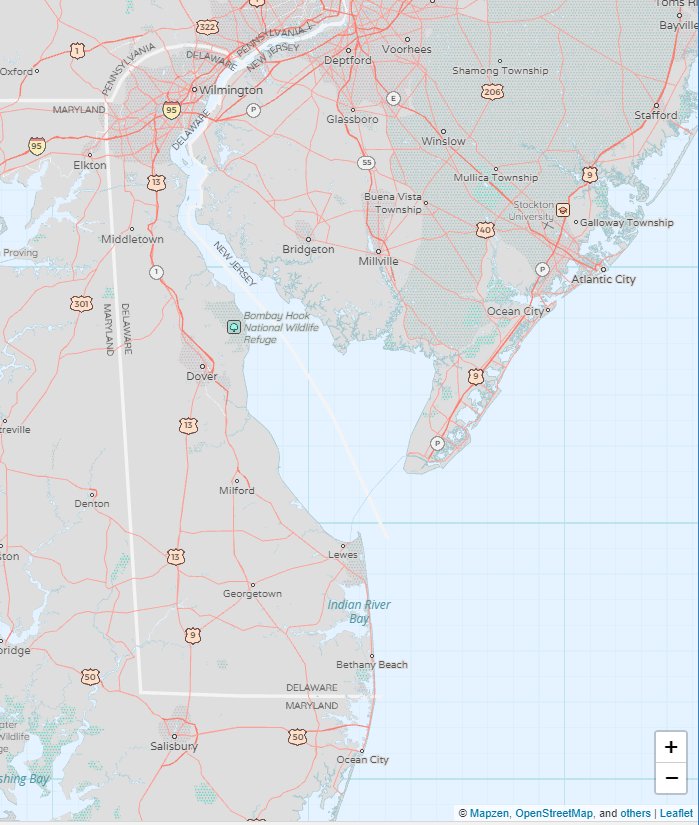
Step 2: Setting an Initial View
At it’s base, your map code looks like this:
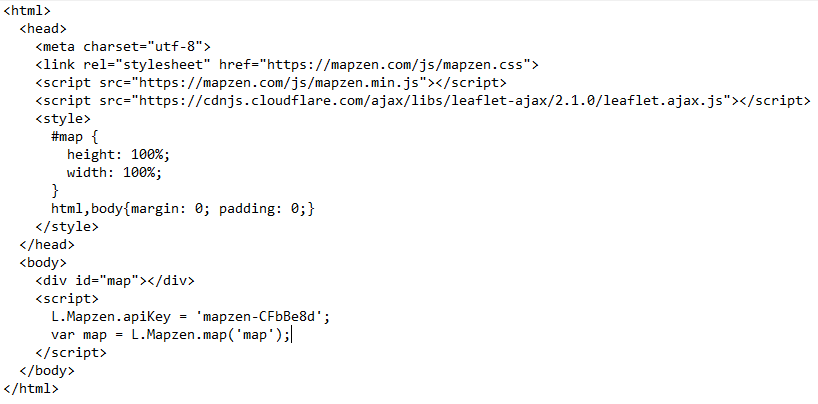
If you load up this base code, you’ll see nothing but a blank grey screen with map icons in the bottom corner.

We can fix that by adding an initial view to the code.
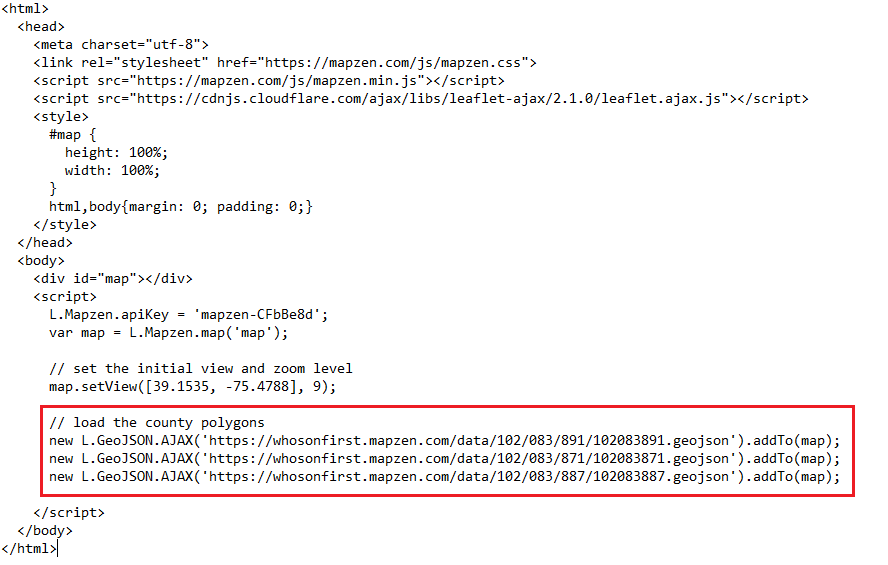
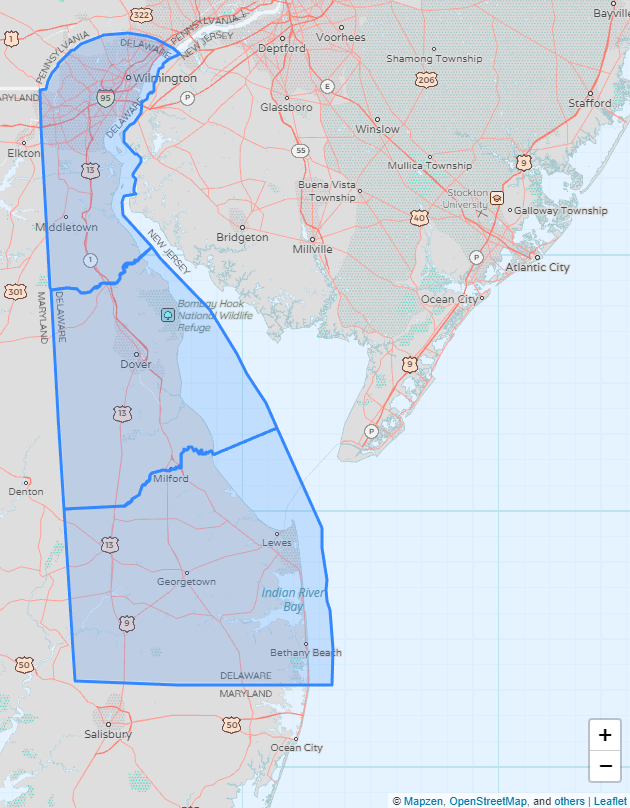
Step 3: Adding County Polygons
Now the shading for the counties. These are really just big polygons, so we’re going to use links to some prewritten geoJSON for each one to make things easier.
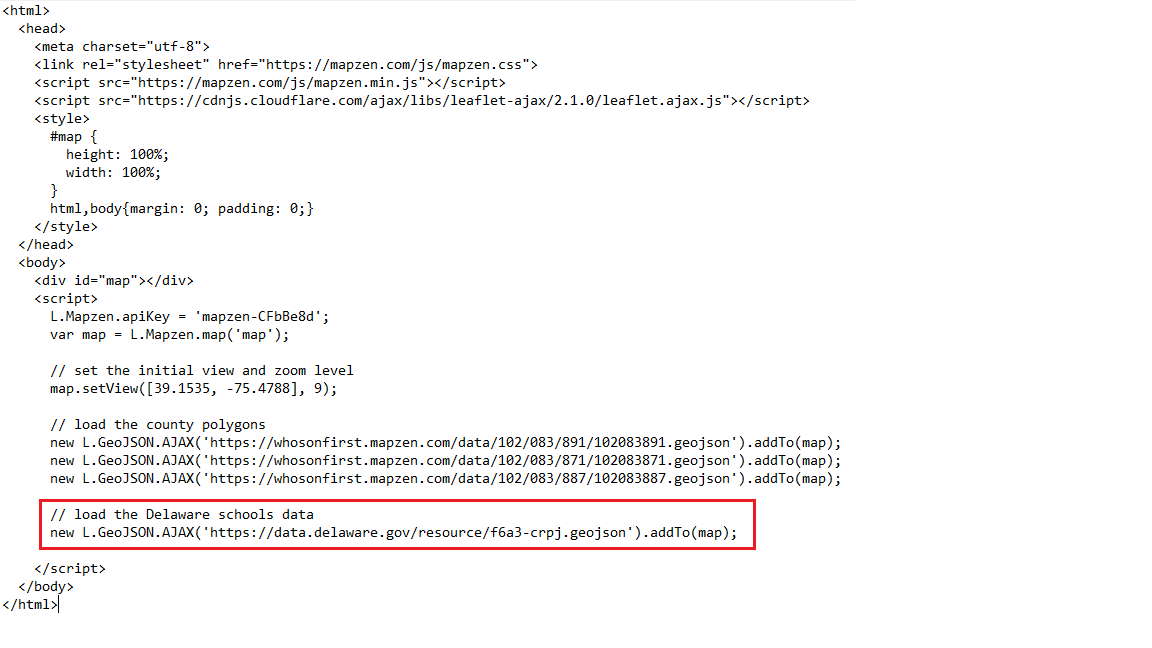
Step 4: Adding School Points
Next, we take some geoJSON data from the Delaware Open Data Portal to load our school points.

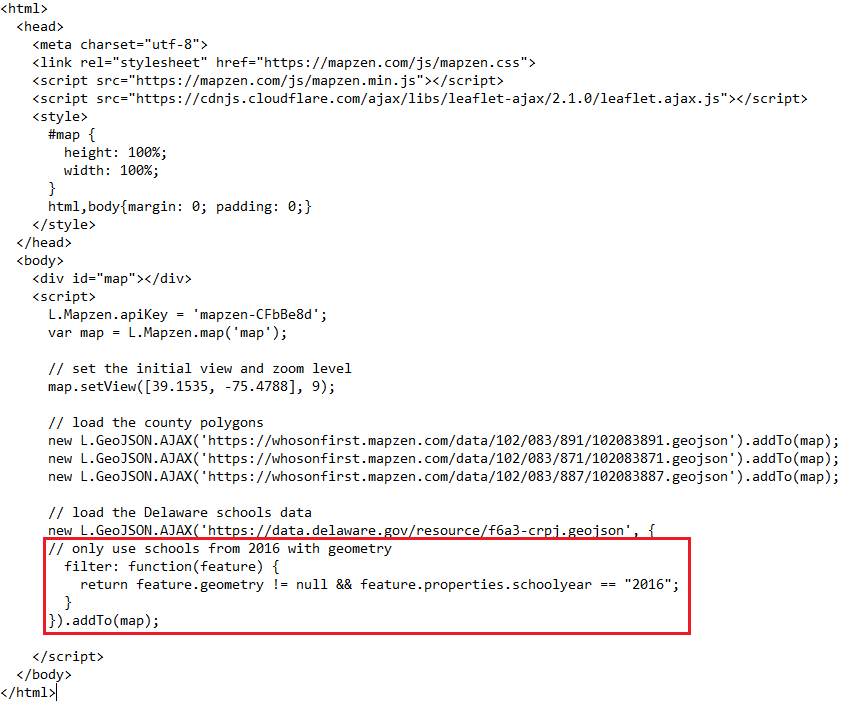
Step 5: Filtering Out Non-2016 Schools
Since this is a ton of data, we’re going to filter it by date to be a bit more useful.
Step 6: Adding Popups
And of course, what are points on a map without the ability to see what they are?
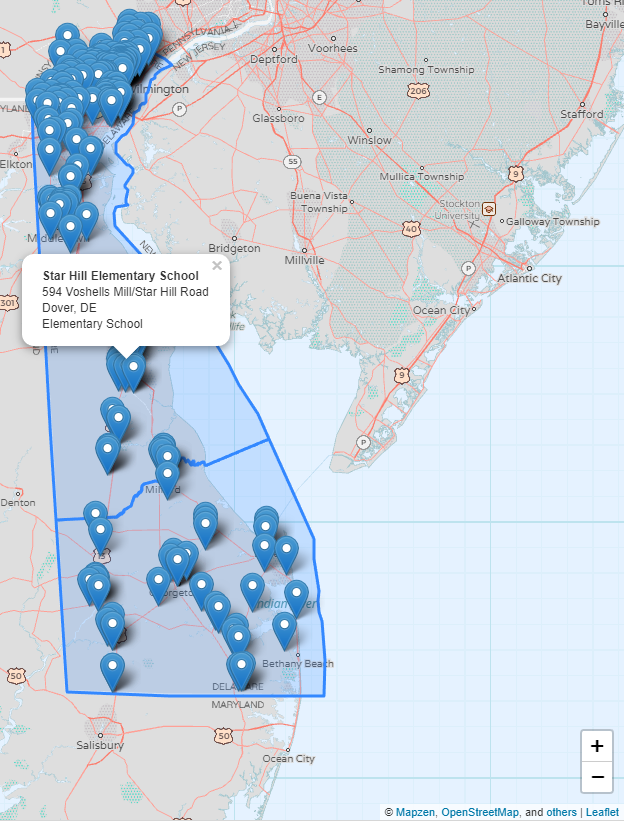
Congrats! You now have a completed, interactive map!
Something really cool about geoJSON.io is it’s ability to connect directly with your personal GitHub Account. You can save all your work for use privately, or even publish it using GitHub Pages.
We want to see your creations! Send us a link to your map so we can showcase it with our community! info@opendatade.com